Debug Probe
The Flipper One Debug Probe enables debugging of Flipper One without fully disassembling the device. It connects via a ribbon cable to the debug port located behind the back plate of Flipper One.
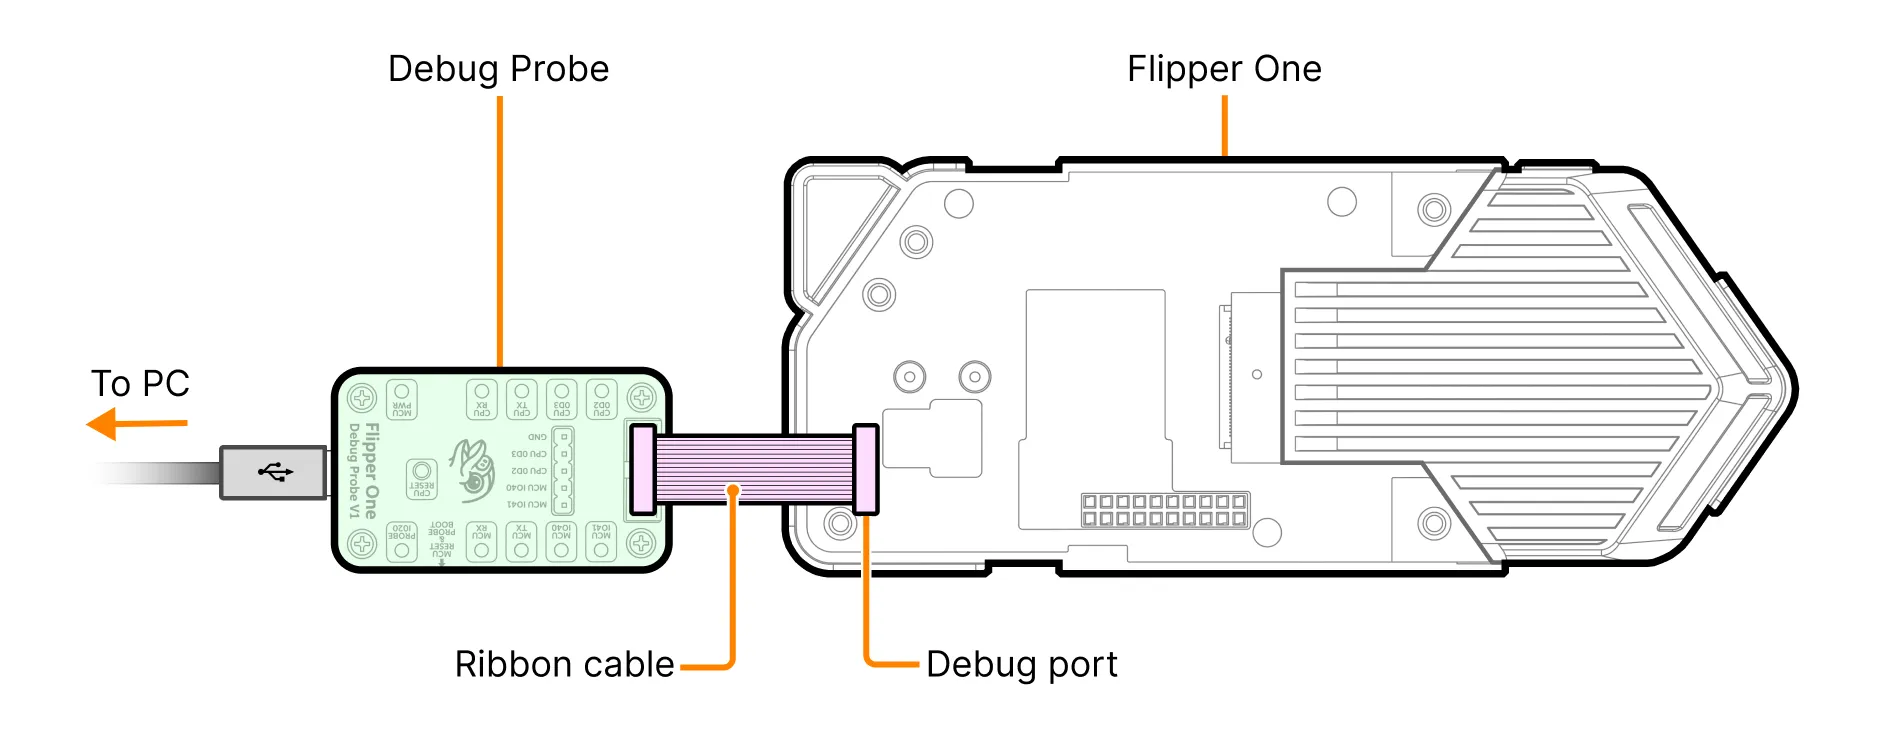
The Flipper One Debug Probe is based on the RP2350 microcontroller. Its hardware design, manufacturing files, and firmware source code are fully open.
Features
The Debug Probe provides the following functionality:
- Debug probe for Flipper One MCU (RP2350) via SWD (Serial Wire Debug). It supports CMSIS-DAP and allows control over CPU execution, access to memory and peripherals, and programming of the MCU flash. The MCU Firmware VS Code project is preconfigured for CMSIS-DAP debugging, allowing you to start a debug session using Debug Probe immediately.
- USB-serial #1 for access to the Flipper One Linux terminal.
- USB-serial #2 for access to the Flipper One MCU CLI (Command Line Interface).
- USB-serial #3 for real-time reading of Flipper One MCU logs.
- USB-serial #4 for access to the Debug Probe CLI (Command Line Interface).
- USB-GPIO bridge providing access to several GPIO pins of the Flipper One CPU and MCU. These pins can be read and write through the Debug Probe CLI.
Buttons and LEDs
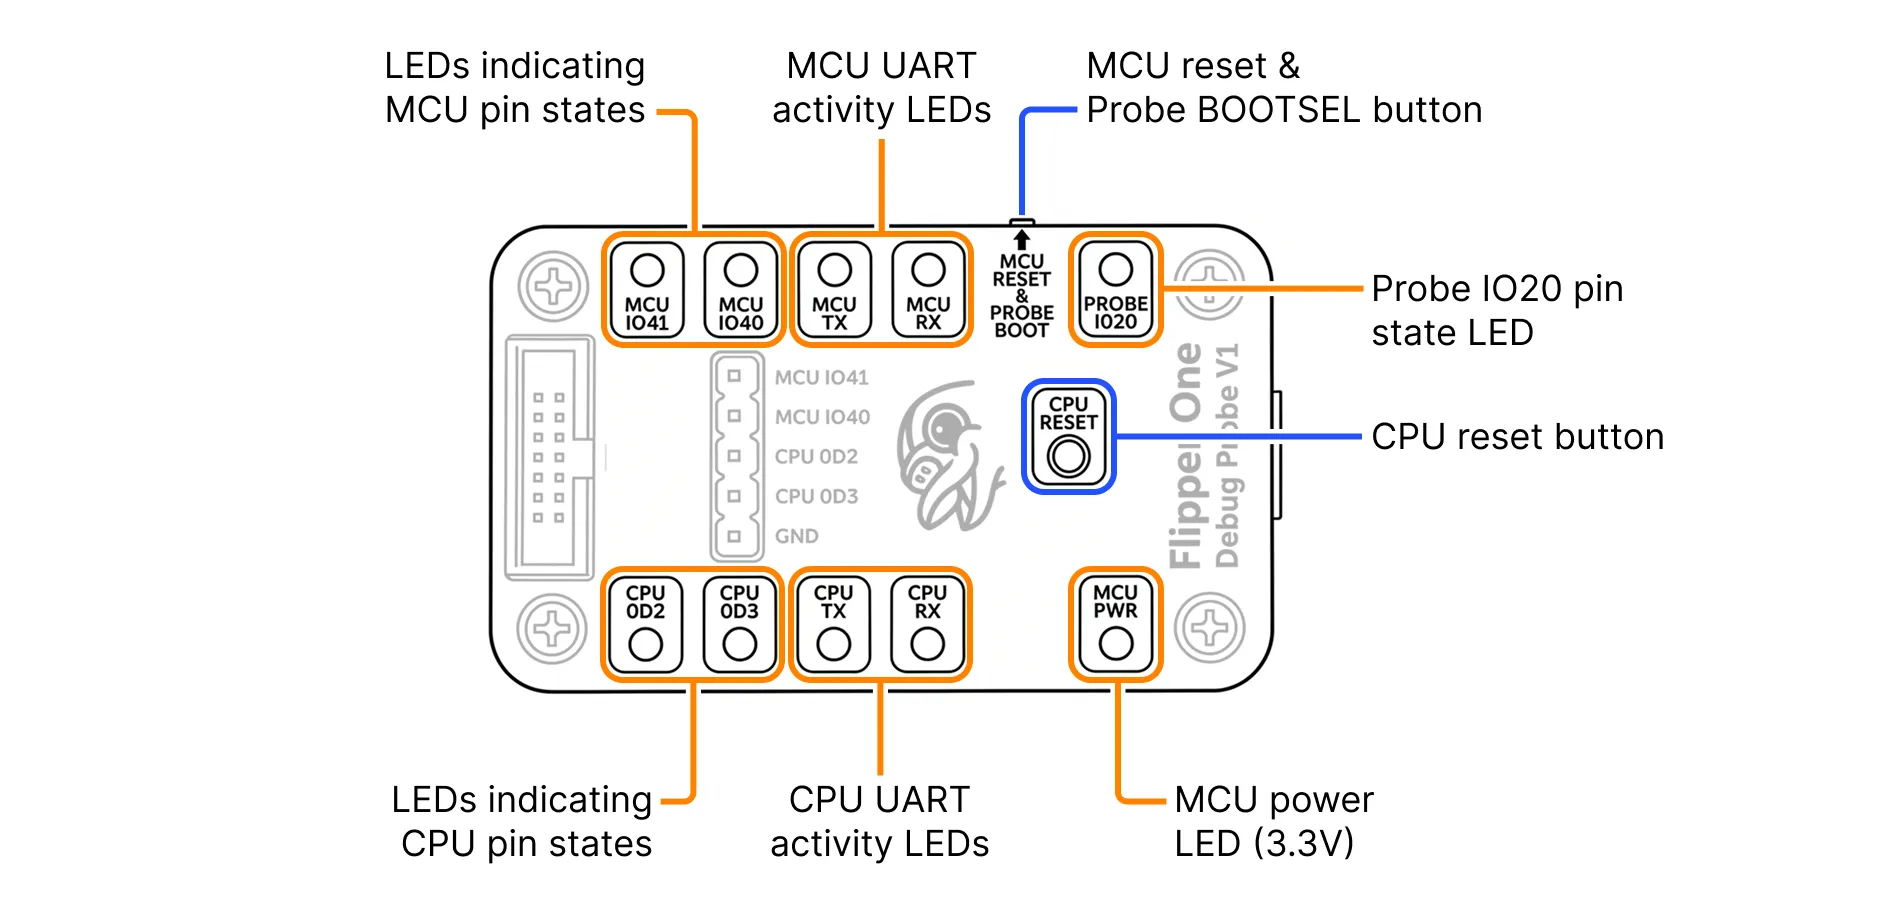
The Debug Probe has 2 buttons:
- CPU RESET — resets the Flipper One CPU (RK3576).
- MCU RESET & PROBE BOOT — resets the Flipper One MCU (RP2350) and puts the Debug Probe into BOOTSEL mode for firmware flashing.
The Debug Probe has the following LEDs:
- MCU power LED (3.3V)
- MCU UART activity LEDs (Tx and Rx).
- MCU IO40 and IO41 pin state LEDs.
- CPU UART activity LEDs (Tx and Rx).
- CPU GPIO0_D2 and GPIO0_D3 pin state LEDs.
- Debug Probe IO20 pin state LED.
Connectors
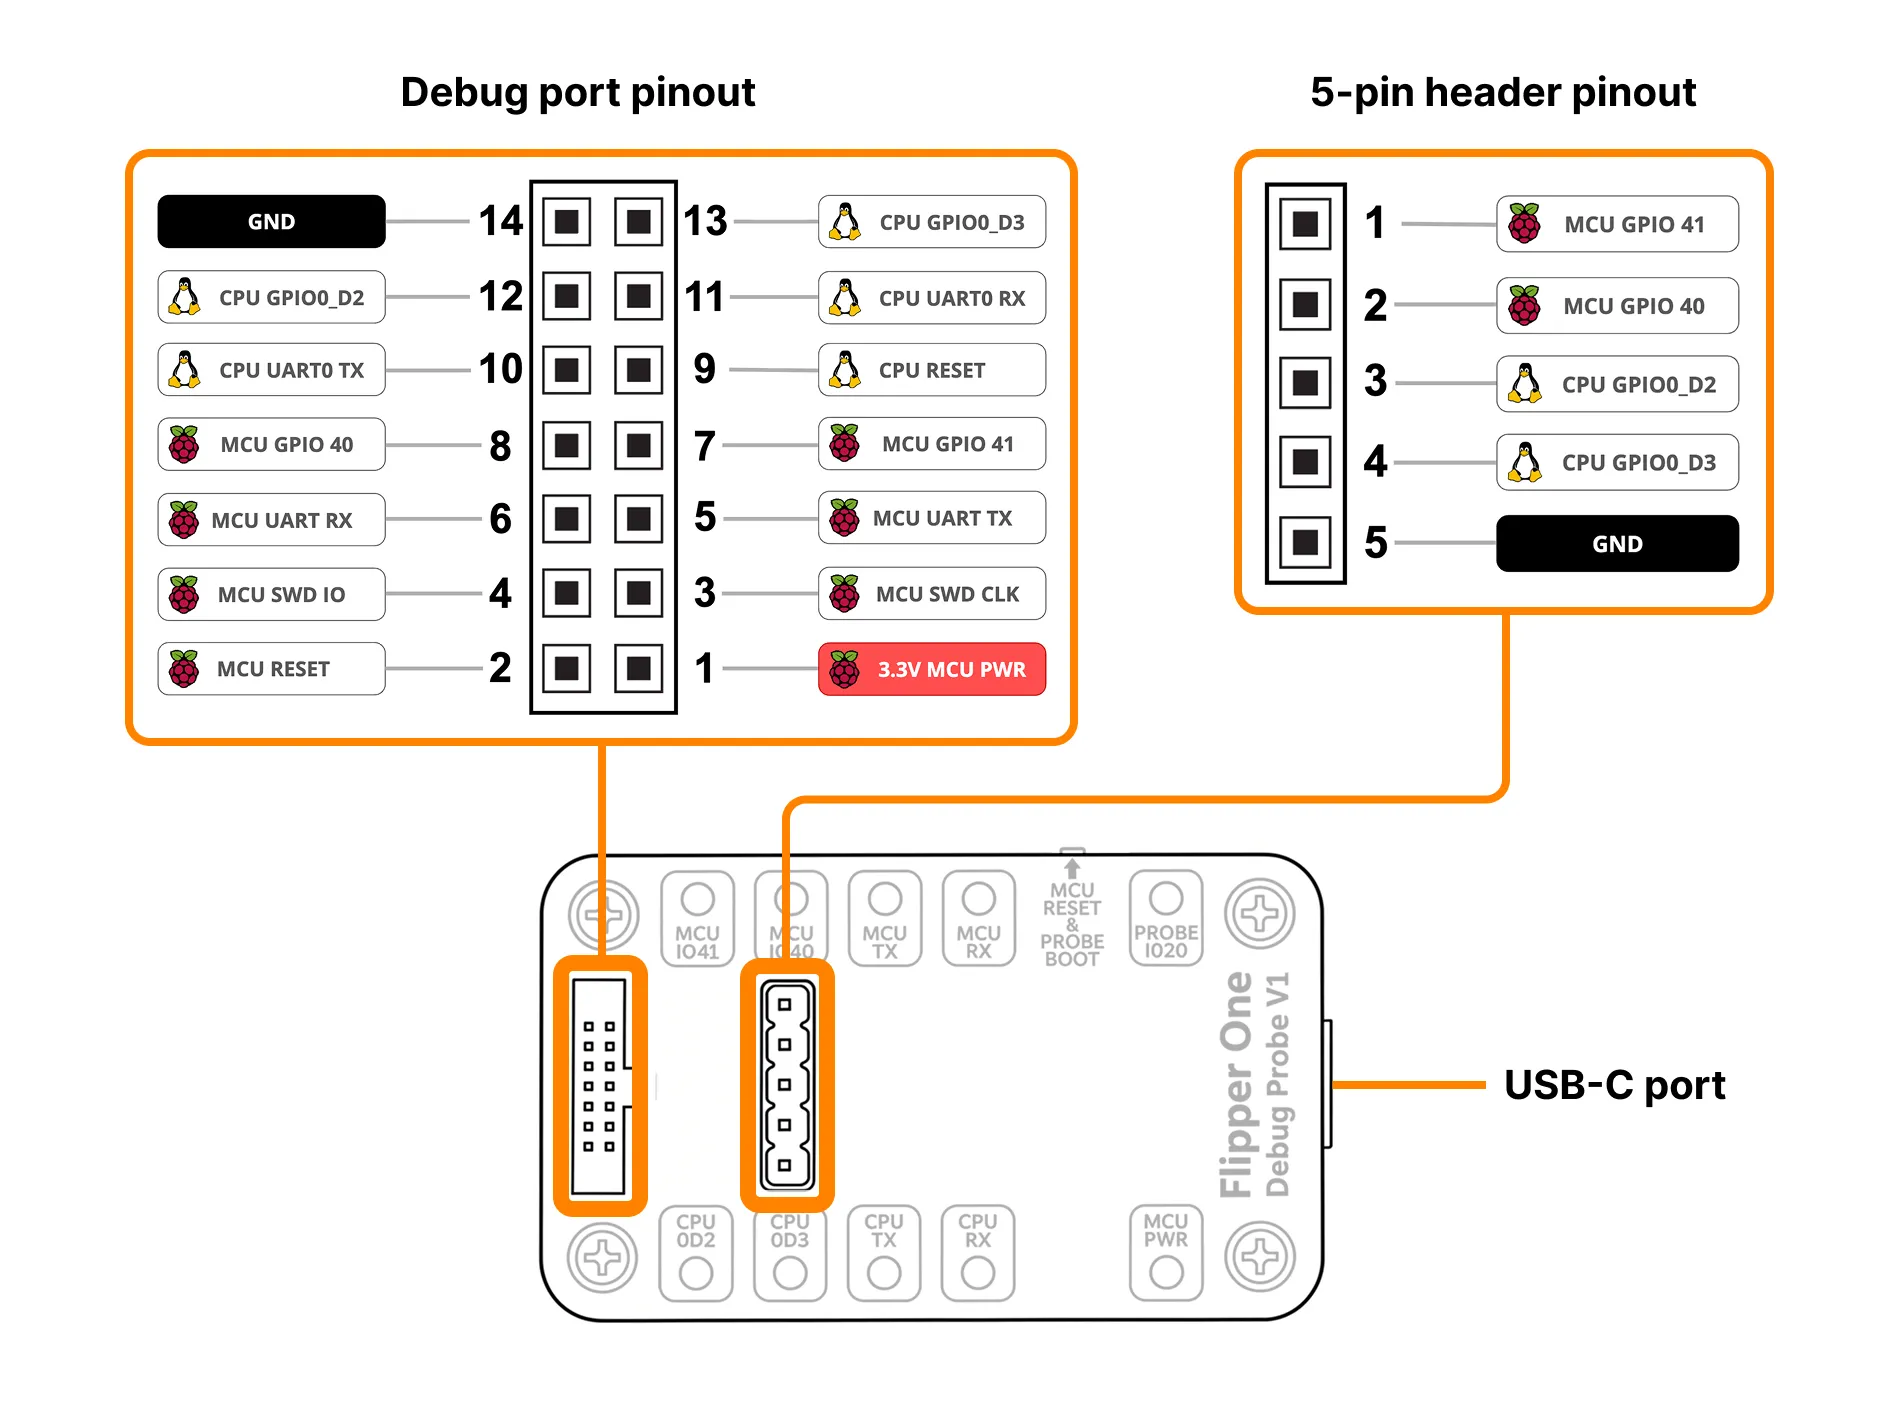
The Flipper One Debug Probe has:
- USB port for connection to a PC.
- Debug port for connecting to the Flipper One debug port.
- 5-pin header for connecting a logic analyzer or oscilloscope to CPU and MCU pins.
Schematics
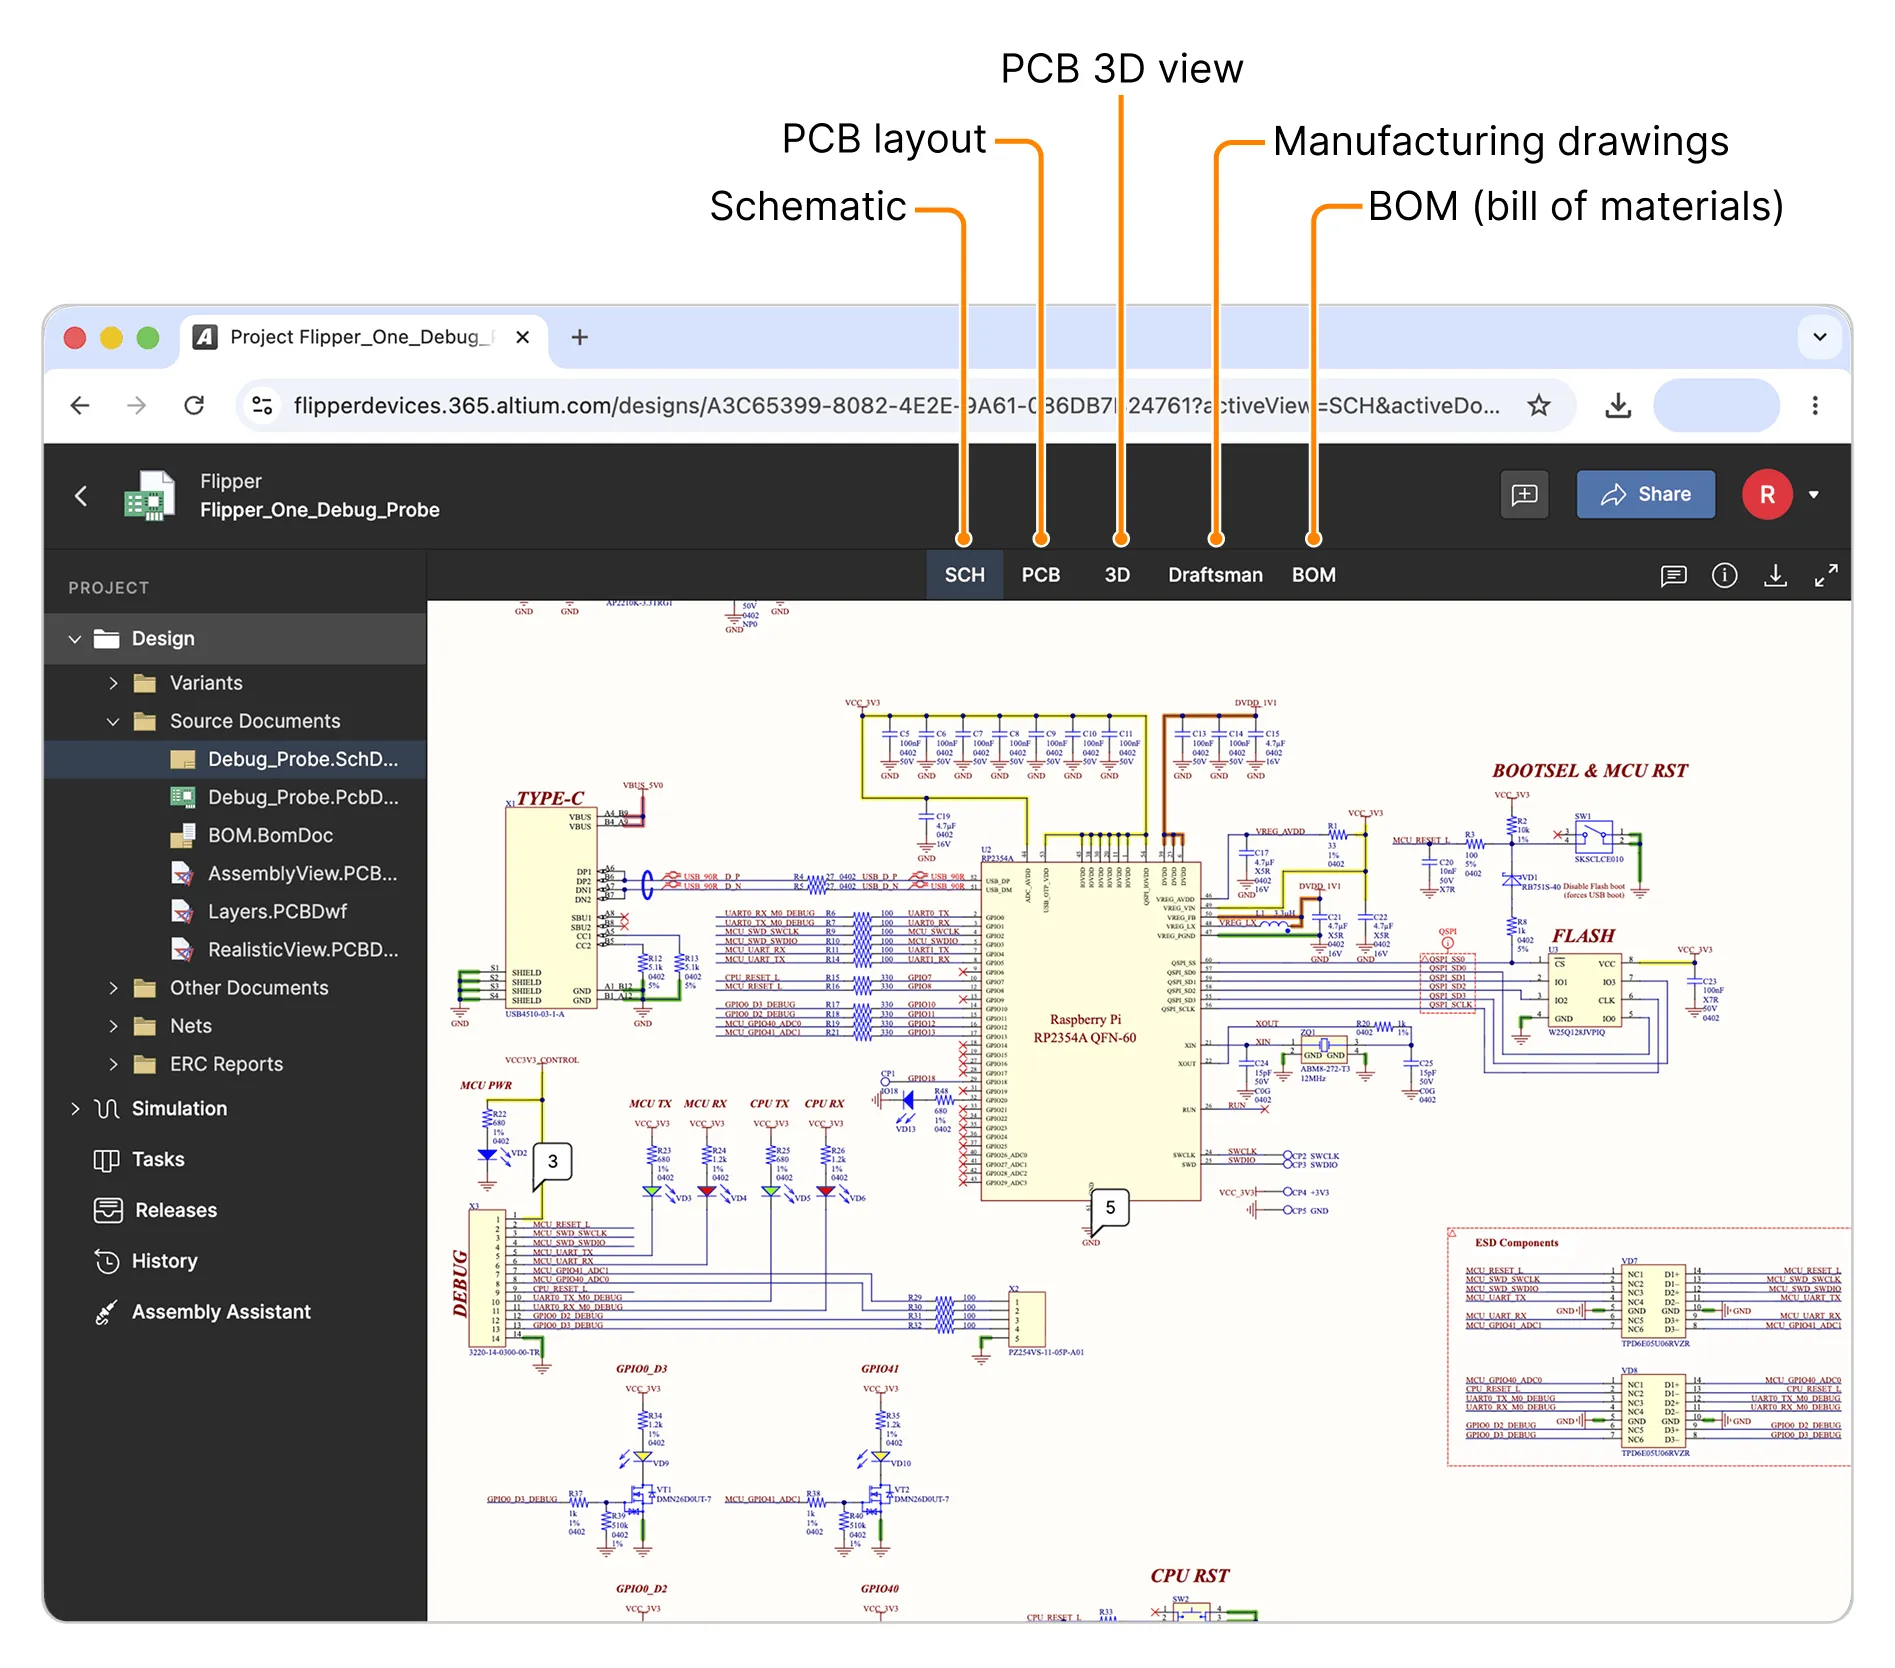
The debug probe hardware is open source and available as a public Altium 365 project. You can view and export the schematic, PCB layout, 3D model, manufacturing drawings, and BOM (bill of materials).
Firmware
The Flipper One Debug Probe firmware is open source. The full firmware source code and prebuilt firmware binaries (.UF2) are available in the flipperone-debug-probe repository.
Below are instructions on:
- How to build the firmwareHow to build the firmware.
- How to flash the firmware via USBHow to flash the firmware via USB.
How to build firmware
In this guide, you will learn how to build the firmware (.UF2) from source code. The resulting file can be uploaded to the Flipper One Debug Probe MCU via USB.
To build the firmware:
Install Visual Studio Code, Python, and git.
Open a terminal in the folder where you want to store the Debug Probe firmware source code.
Clone the MCU firmware repository to your computer:
git clone --recursive https://github.com/flipperdevices/flipperone-debug-probe
Open Visual Studio Code and go to File → Open Folder... and select the flipperone-debug-probe folder you just cloned.
Visual Studio Code will prompt you to install the recommended extensions. Click Install to accept, and wait until the process is complete.
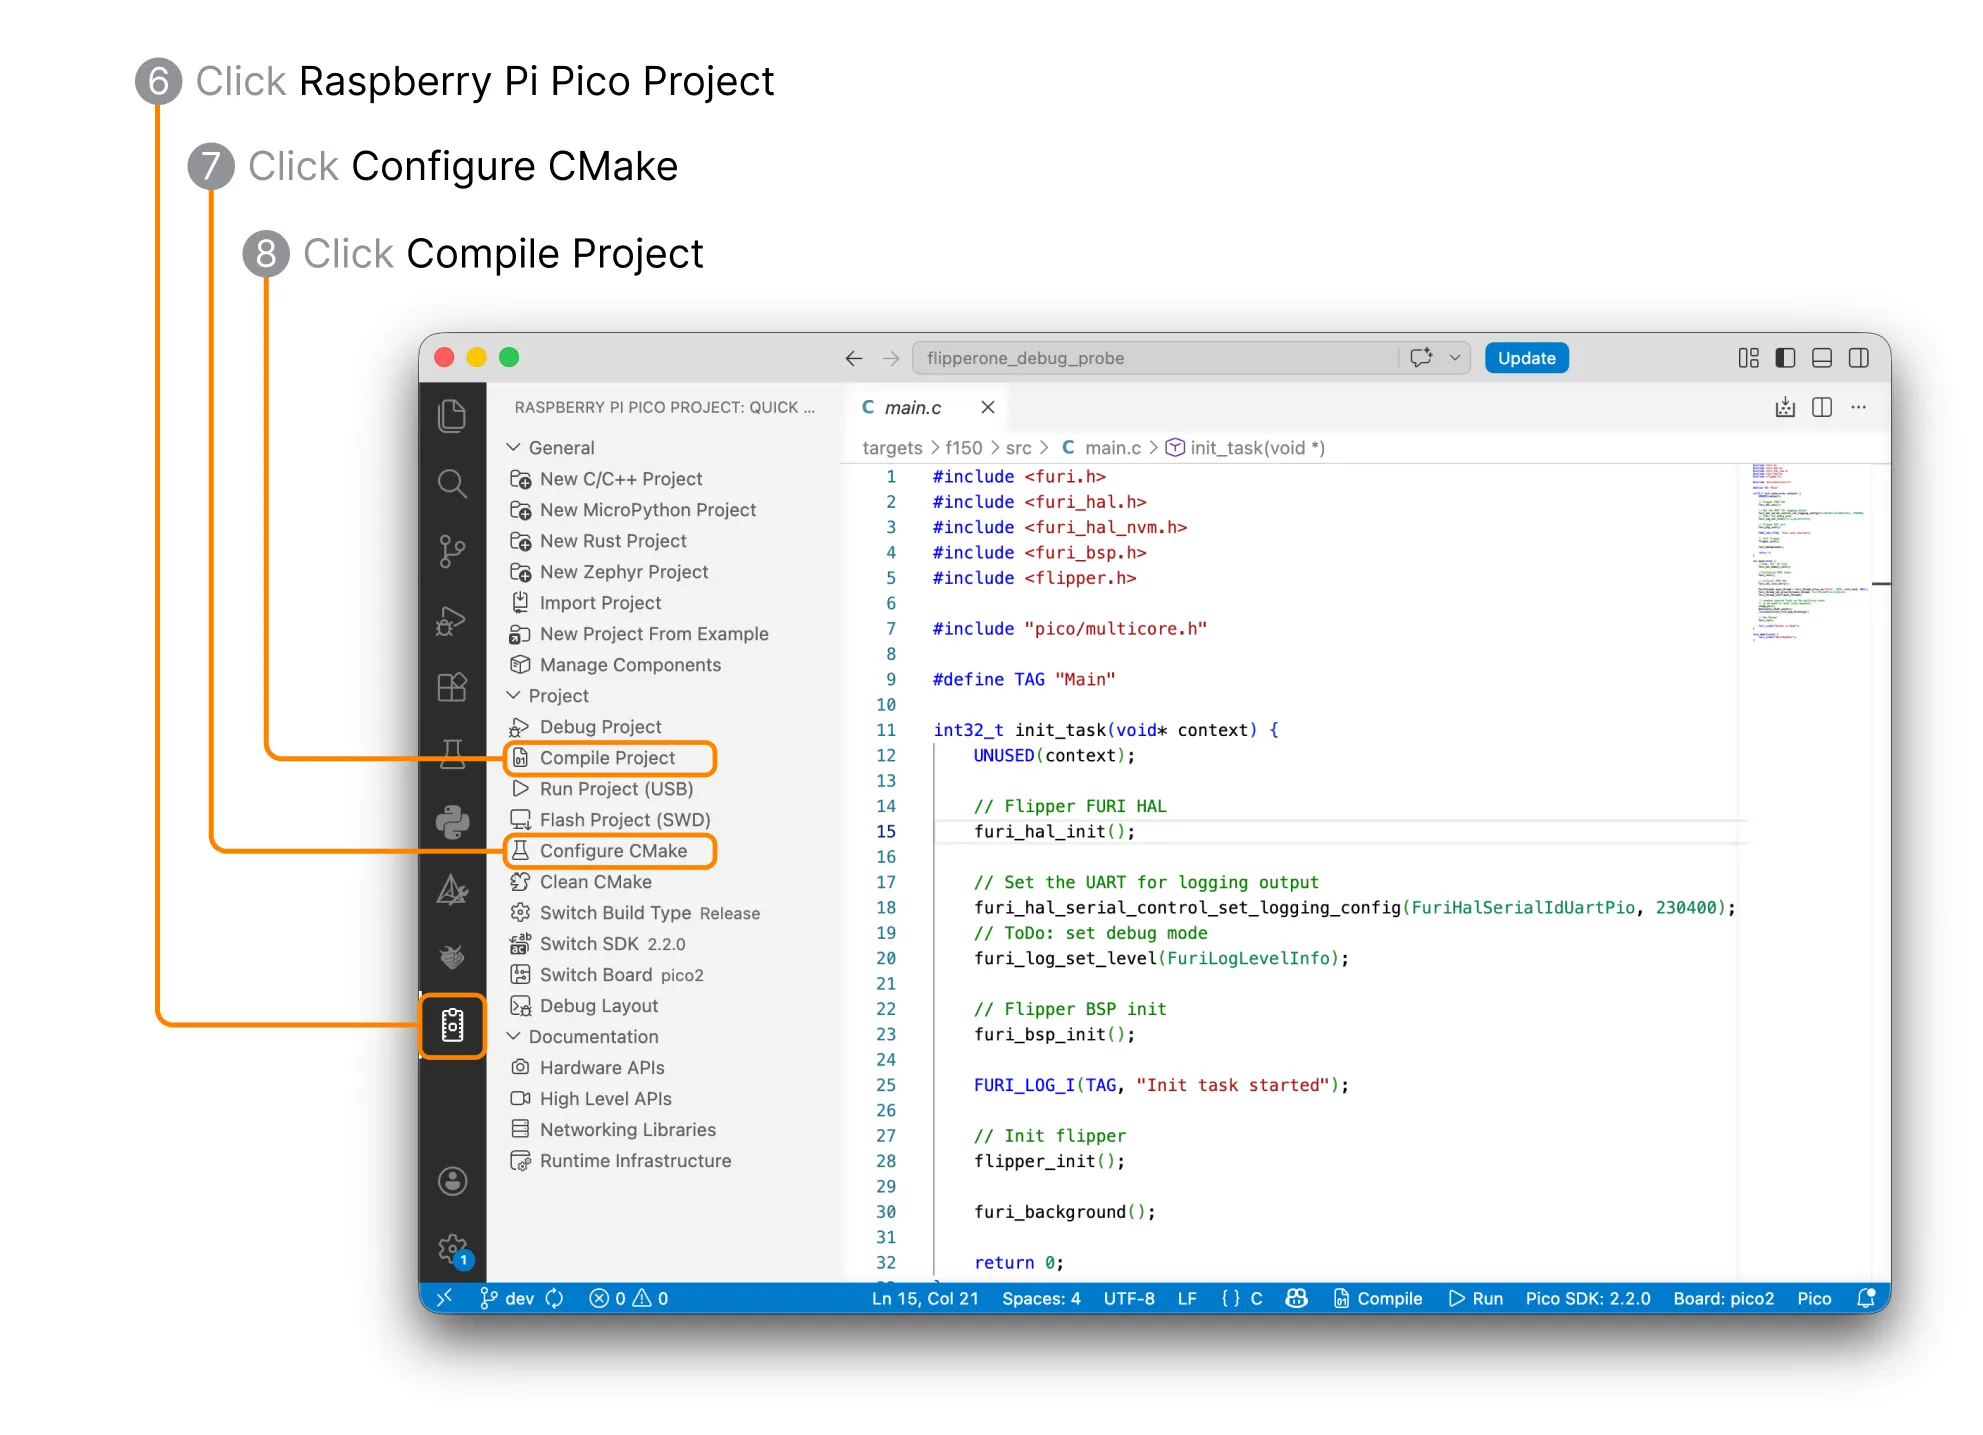
Click Raspberry Pi Pico Project in the left sidebar.
Click Configure CMake.
Click Compile Project.
After a successful build, the resulting UF2 file will be located in the flipperone-debug-probe/build folder.
How to flash firmware
In this guide, you will learn how to flash the firmware (.UF2) to the Flipper One Debug Probe via USB:
Get the .UF2 firmware file.
- Build the file from source codeBuild the file from source code — if you modified the firmware.
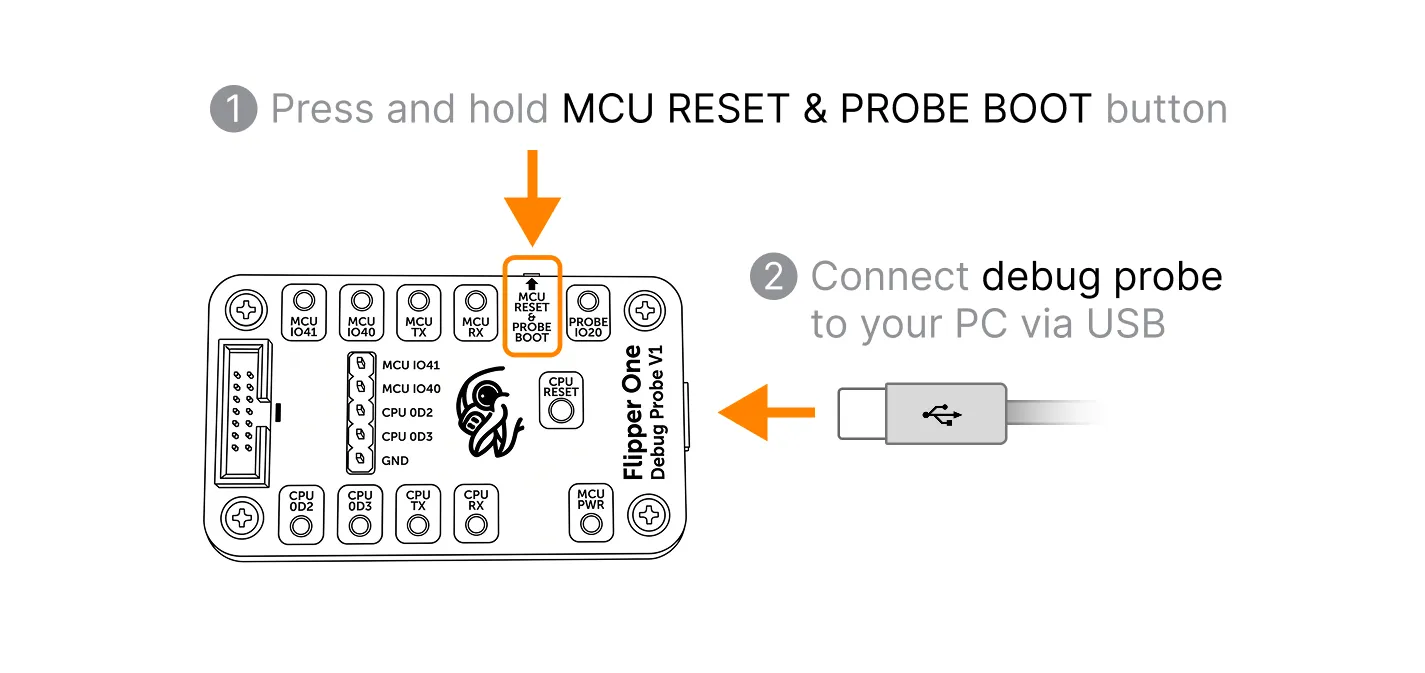
Switch the Debug Probe MCU to BOOTSEL mode by holding the MCU RESET & PROBE BOOT button while connecting the Debug Probe to a PC via USB.
After switching the Debug Probe MCU to BOOTSEL mode, the device appears on your PC as a Mass Storage Device named RP2350.
If it does not appear, try a different USB cable and repeat the BOOTSEL procedure.
Upload the .UF2 firmware file to the RP2350 Mass Storage Device.
Once the .UF2 file upload is complete, the Debug Probe will automatically reboot and the Mass Storage Device will disconnect from your PC — the Ddebug Probe has been successfully updated.
Usage
Serial Ports
The Flipper One Debug Probe is detected by the operating system as four serial ports. Port names and paths may vary depending on your operating system.
Example device paths on macOS:
Port | Device path | Description | Baud rate |
|---|---|---|---|
Port 1 | /dev/tty.usbmodemflip_one_debug2 | RK3576 CPU console | 1500000 |
Port 2 | /dev/tty.usbmodemflip_one_debug4 | Flipper One MCU CLI | 230400 |
Port 3 | /dev/tty.usbmodemflip_one_debug6 | MCU debug log | 230400 |
Port 4 | /dev/tty.usbmodemflip_one_debug8 | Debug Probe MCU CLI | 230400 |
Connect to the RK3576 CPU Console on macOS
This example shows how to connect to the RK3576 CPU console on macOS.
We recommend using tio, because it is lightweight and stable. You can install it with brew install tio
Basic connection
tio -b 1500000 /dev/tty.usbmodemflip_one_debug2
Connection with timestamps
Use timestamps to see delays between boot log lines and identify where the boot process slows down:
tio --timestamp --timestamp-format 24hour-delta -b 1500000 /dev/tty.usbmodemflip_one_debug2